It’s a familiar Monday morning scenario for many engineering teams.
A ticket arrives from the Customer Support lead or the Operations Manager: “The admin panel is unusable today. It takes 10 seconds just to load the user management list. We can’t do our jobs.”
As a developer, your first instinct is to look for the “monster.” You check the slow query logs for massive analytical queries—the ones joining seven tables and crunching millions of rows to generate an end-of-month report.
But sometimes, the monster isn’t there. The database CPU is spiking, but the queries running aren’t complex. In fact, they look incredibly simple.
How can a three-line SQL query cripple an entire application?
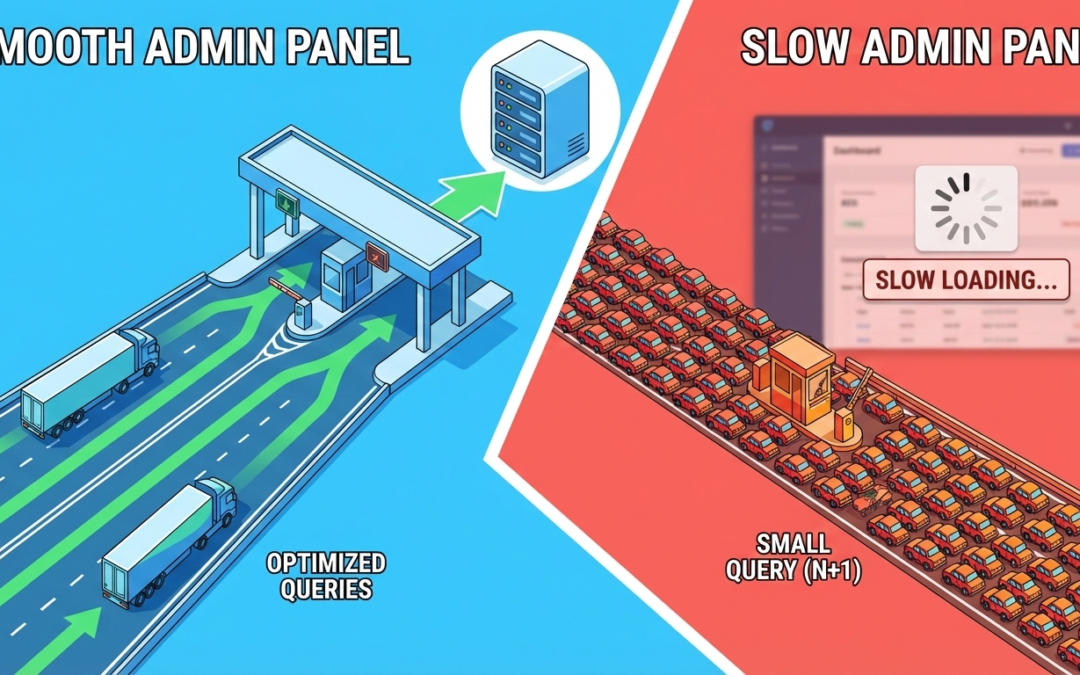
It turns out, database performance isn’t just about how big a query is. It’s about how often it runs and how hard the database has to work to answer it.
Here is how a small query causes big problems, and why it often happens in admin panels.
The “Death by a Thousand Cuts” (The N+1 Problem)
By far the most common reason for a sluggish admin overview page is the infamous “N+1 Query Problem.”
This happens when your application code is “lazy.” It fetches a list of main items first, and then, in a loop, fetches related data for each individual item.
The Scenario
Imagine an admin dashboard showing a list of the 50 most recent e-commerce orders. The page needs to show the Order ID and the Customer Name.
How it should work (Eager Loading): The application sends one smart query to the database: “Give me the latest 50 orders and join them with the customer table so I know their names.” Total Database Trips: 1.
How it often works by mistake (The N+1 scenario):
-
The code first asks: “Give me the latest 50 orders.” (This is 1 query).
-
The code then starts a loop to render the page.
-
Inside the loop for Order #1, it realizes it needs the customer name. It asks the DB: “Who belongs to Customer ID 555?”
-
Inside the loop for Order #2, it asks: “Who belongs to Customer ID 556?”
It repeats this 50 times.
The Result: To load a single page, your application just hit the database 51 times (1 initial query + 50 subsequent queries) instead of once.
Why it kills performance: Each one of those tiny queries is fast on its own—maybe 2 milliseconds. But 50 queries x 2ms = 100ms of pure database network back-and-forth, just for one part of the page.
Now, imagine 20 support agents loading that dashboard simultaneously. That’s 1,000 rapid-fire queries hitting the database at once. The connection pool fills up, the CPU spikes, and the admin panel grinds to a halt.
The “Needle in a Haystack” (Missing Indexes)
The second way a tiny query destroys performance is when it forces the database to read too much data.
A database index is like the alphabetical tabs in an old-school physical phone book. If you are looking for “Smith,” you flip right to ‘S’. You find it instantly.
If that phone book had no alphabetical tabs and the names were listed randomly, to find “Smith,” you would have to read every single name in the book until you found it.
The Scenario
Your admin panel has a search bar to find users by their email address. The query is incredibly simple:
SELECT * FROM users WHERE email = 'bob@example.com';
If there is an index on the email column, the database goes straight to Bob. It takes 1 millisecond.
If there is no index, the database must scan every single row in the users table to ensure it doesn’t miss Bob.
Why it kills performance: In your development environment, you might only have 100 test users. Scanning 100 rows is instantaneous. You’ll never notice the missing index.
In production, you might have 500,000 users. Suddenly, that “tiny” query is forcing the server to read half a million rows from disk just to log one agent in.
Why We Miss These Issues in Development
The insidious thing about these “small query” problems is that they are usually invisible during development and testing.
Developers work with small, clean datasets on powerful local machines with zero network latency. An N+1 issue running 10 times is unnoticeable. A missing index on 50 rows is unnoticeable.
The problems only compound and explode when deployed to production, where the dataset is massive and multiple users are hammering the system concurrently.
The Takeaway
When your internal tools slow down, don’t just look for the complex queries.
Open your browser’s network tab or your server logs and count the number of requests. If loading one dashboard triggers 200 separate database calls, you’ve found your problem.
Internal tools deserve performance love too. A slow admin panel isn’t just a technical annoyance; it’s an operational tax on your entire company’s productivity.